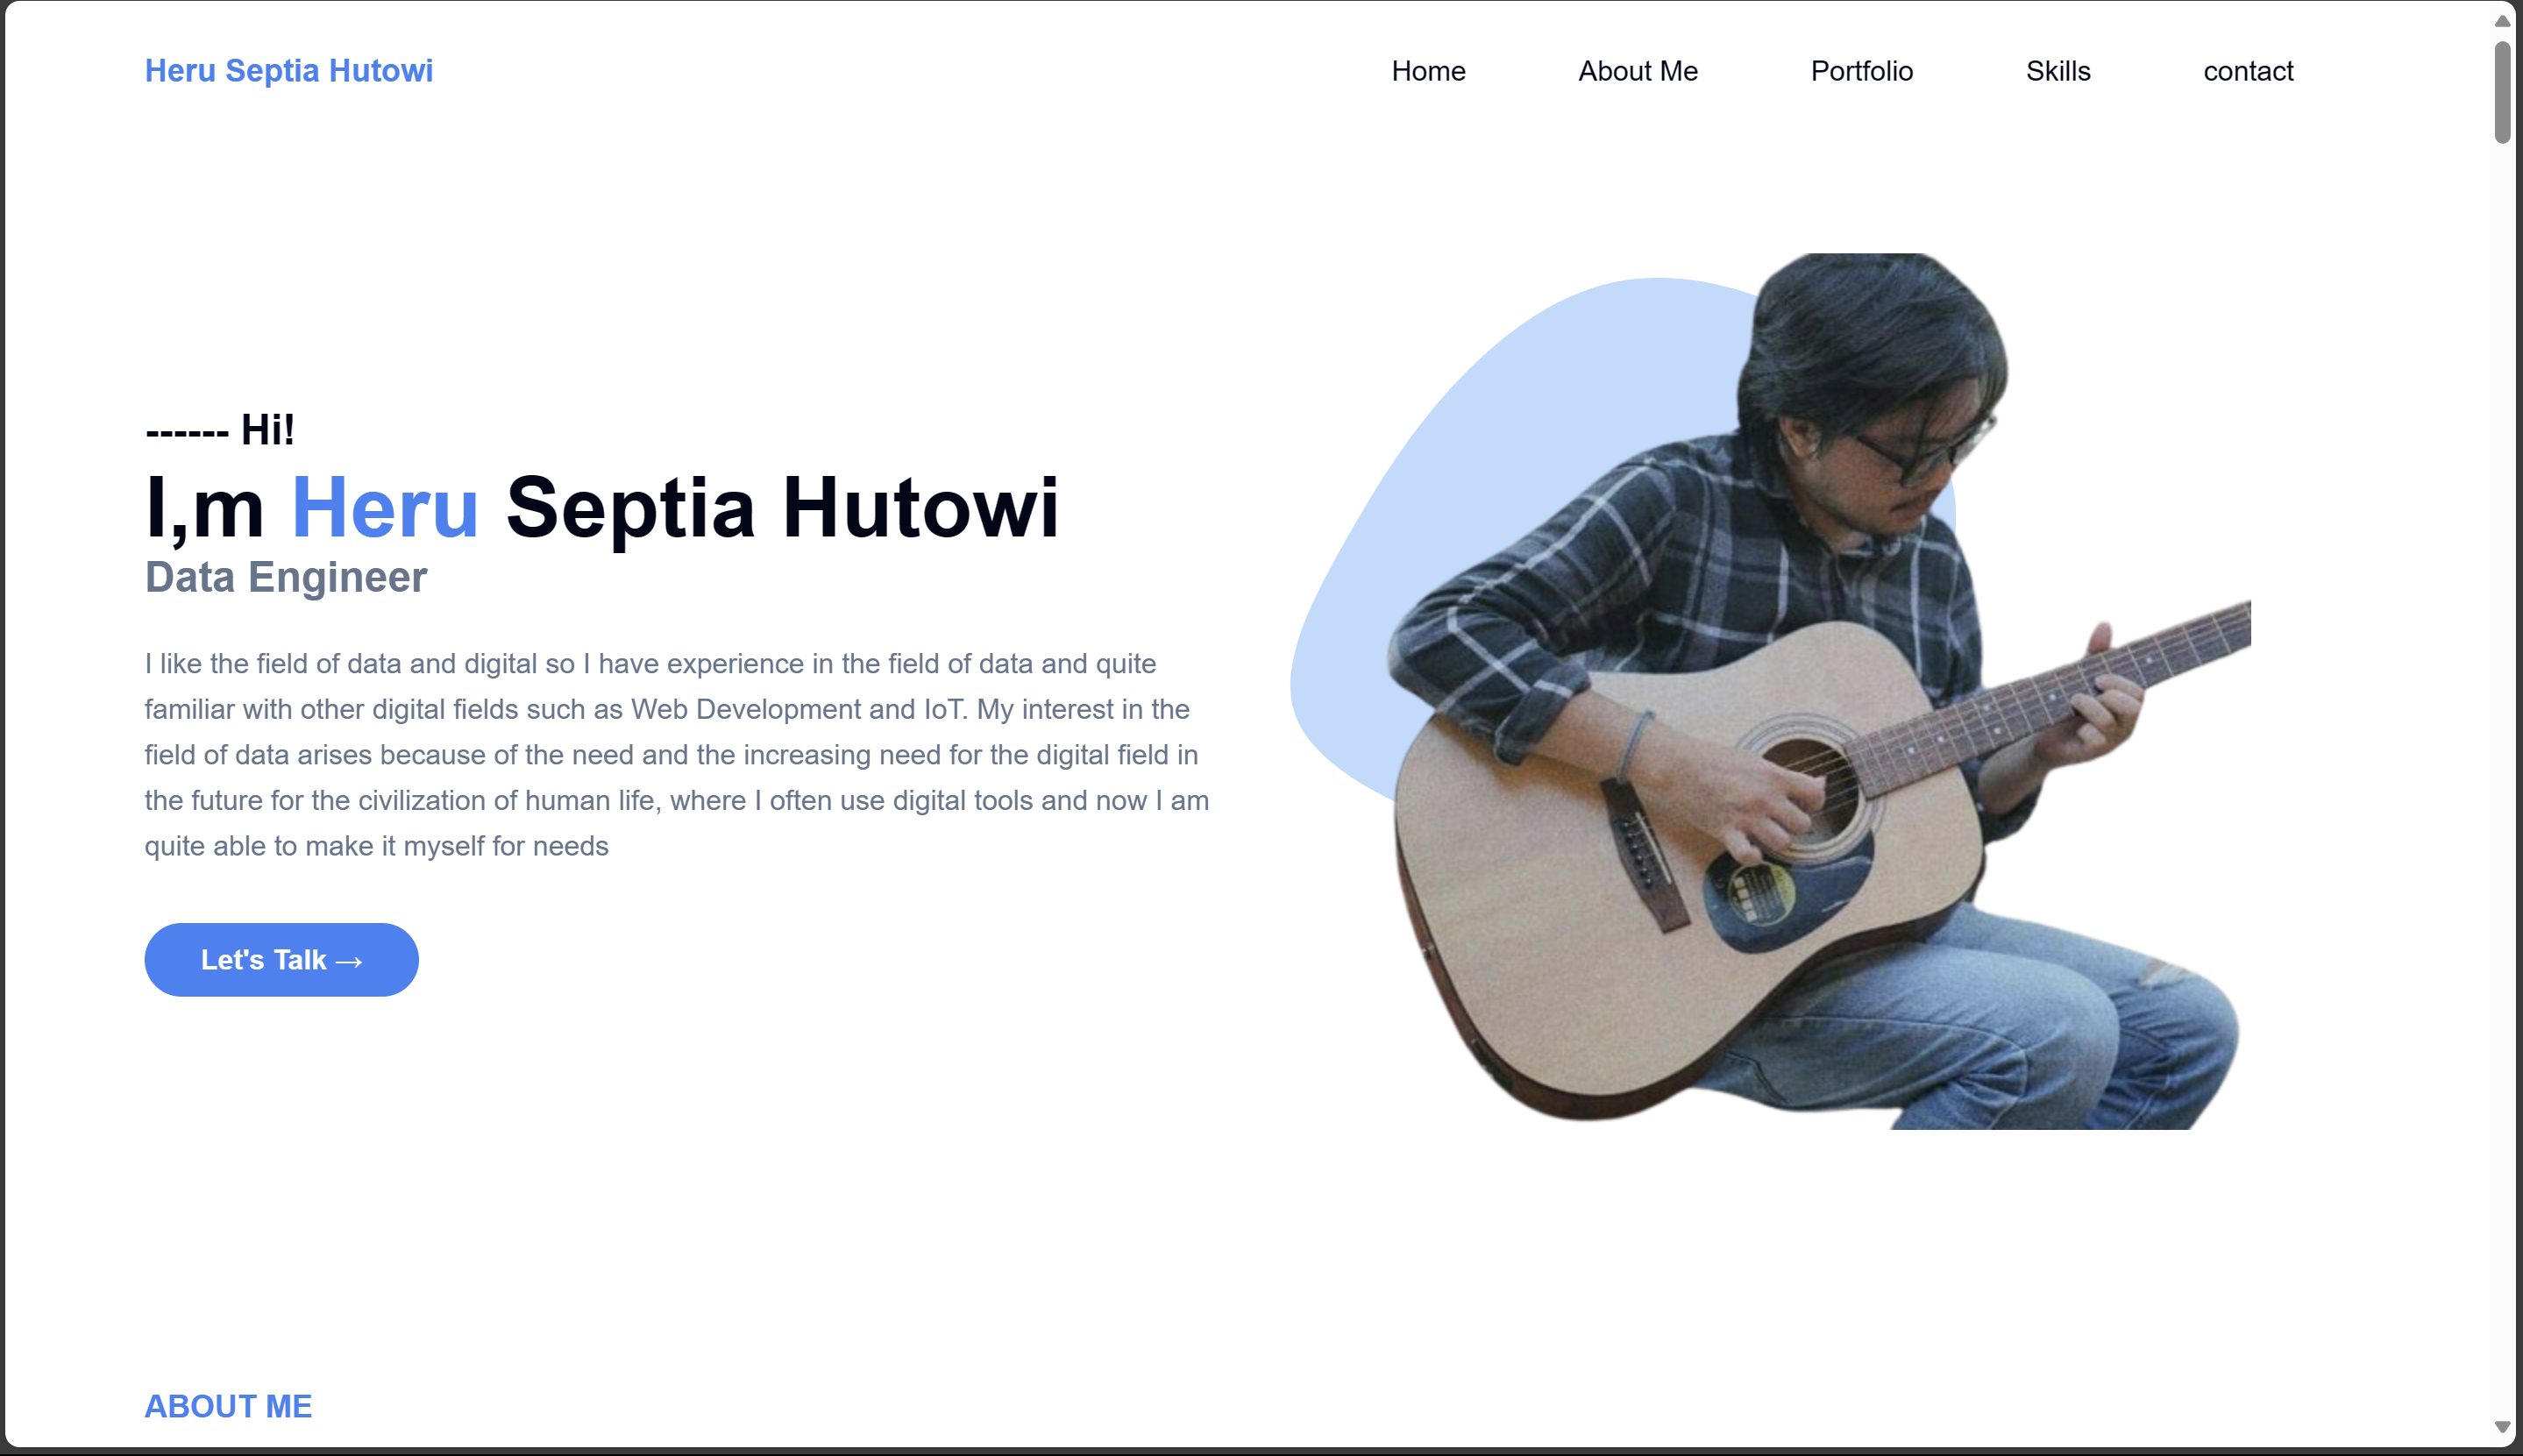
I like the field of data and digital so I have experience in the field of data and quite familiar with other digital fields such as Web Development and IoT. My interest in the field of data arises because of the need and the increasing need for the digital field in the future for the civilization of human life, where I often use digital tools and now I am quite able to make it myself for needs
Let's Talk →This experience was my virtual internship at Kimia Farma with the theme Big Data Analytics. This activity started in early March 2024 and ended in early April 2024. Here I gained a lot of knowledge and experience in applying Big Data tools in the world of work, such as using the Google Big Query data warehouse to analyze large amounts of data and using Google Looker Studio for Data Visualization.
This is the final project of the virtual internship program held by Rakamin for data engineers at the ID/X Partners company. The task given was to help one of the clients from the ID/X Partners company regarding creating a data warehouse. The problem they experienced was that they had difficulty extracting data from various sources and data types into one data warehouse. The process of working on this project starts from creating a data warehouse called DWH using the Microsoft SQL Server database application. The creation of this data warehouse refers to the needs according to the client's orders. After creating the data warehouse, data from various sources and data types is transformed using the Talend Studio application and at the final stage the data that has been transformed to the DWH data warehouse is created as a stored producer called Daily Transaction and BalancePerCustomer. The process of working on this project was very impressive starting from the extract, transfer and load stages for me because it was very insightful
This machine learning project is the final project of the Dicoding Indonesia course, namely Learning the Basics of Machine Learning. This project uses Tensor Flow. To build a machine learning model, namely by defining the problem statement you want to solve. At this stage we determine what problem we want to solve and how the implementation of the artificial neural network model can solve the problem. Once we understand the problem, we can develop an artificial neural network model as a solution. In this exercise we will create a model to classify images of a room and predict whether the room is neat or messy. At the end of the exercise we can test the model that has been created using the input image later. It was quite difficult to work on this project because the tensor flow framework was very new to me
I created this Linktree based on my accident seeing content from one of the TikTok content creators who discussed web development named Helmi Satria. From seeing the process of creating a Linktree that he provided, I have a background in the data field and am quite familiar with web development and tried to follow the tutorial. This project was created using technology from a fairly new Java script framework called Astrojs. Using this technology is very suitable for creating landing pages or other simple web development projects because this frame work is very simple and suitable to use. I am hosting the results of this project using vercel so that later I can use it for an introductory profile
In early 2023, I was interested in studying the field of web development by myself. There are many YouTube content creators whose tutorials and knowledge I follow, one of whom I admire is Sandika Galih, from the tutorial she gave I was able to create a portfolio website project. creating this website using Tailwindcss, starting from the process of setting the node modules used then creating the HTML structure, then creating the website landing page until finally hosting the website on vercel. Making this website is quite long for me who only knows HTML, CSS and Java Script, but with my liking for the process, even though I sometimes find errors that are difficult to resolve, I am able to complete it quite perfectly.
In late 2020, after almost 1 year of studying data science, I tried studying data visualization. The data visualization tool that I often study is Tableau, my learning process resulted in one of the data visualization projects from the US Flight Delay case study. The data was obtained from the Kaggle.com site, which I then carried out data cleaning and exploration of data analysis of which data would be displayed in Tableau. After the data is clean, the data is input into Tableau, the visualization process starts with things that influence decisions and problems which will later be displayed on the dashboard. The tools and menus provided by the Tableau Public application are very easy to use and simple
The first time I studied the data field, especially Data Science, was in 2022. I studied through a course held by Kominfo for digital field training for fresh graduates. I took training to learn basic data science at DQLab. Here I learn R and SQL languages to analyze data. It was quite difficult for me at that time because I was new to the field of data scientists and the tools were still unfamiliar to me. During 3 months of study, a final project was given to analyze Covid-19 data in Indonesia, which at that time was at the height of the Covid-19 outbreak. The data comes from the Kaggle.com website and the analysis tool used uses R. The experience of working on this project was the starting point for me to get to know the field of data.
Order further or collaborate, you can contact me via the form below